Forecasting donation revenue for a small nonprofit does not require a finance degree, expensive software, or a dedicated development team. Our team has worked with dozens of organizations under $1M in annual revenue, and the ones who plan well tend to keep their staff, hit their missions, and sleep better at night. In this guide, I will walk you through the exact framework we recommend for any small nonprofit donation revenue forecast: gather your historical data, analyze the trends, categorize your revenue, apply probability weights, and build three scenarios. By the end, you will have a clear, board-ready forecast you can actually defend.
If you are a one-person development shop or an executive director who also writes the grants, this is for you. We have kept every step to what a small team can actually execute on a Tuesday afternoon.
Table of Contents
- 1Why Donation Revenue Forecasting Matters for Small Nonprofits
- 2How Should Small Nonprofits Forecast Donation Revenue?
- 3Gather Your Historical Giving Data (3-5 Years Minimum)
- 4Analyze Historical Trends and Identify Patterns
- 5Categorize Your Revenue Sources
- 6Apply Probability Methods to Grants and Pledges
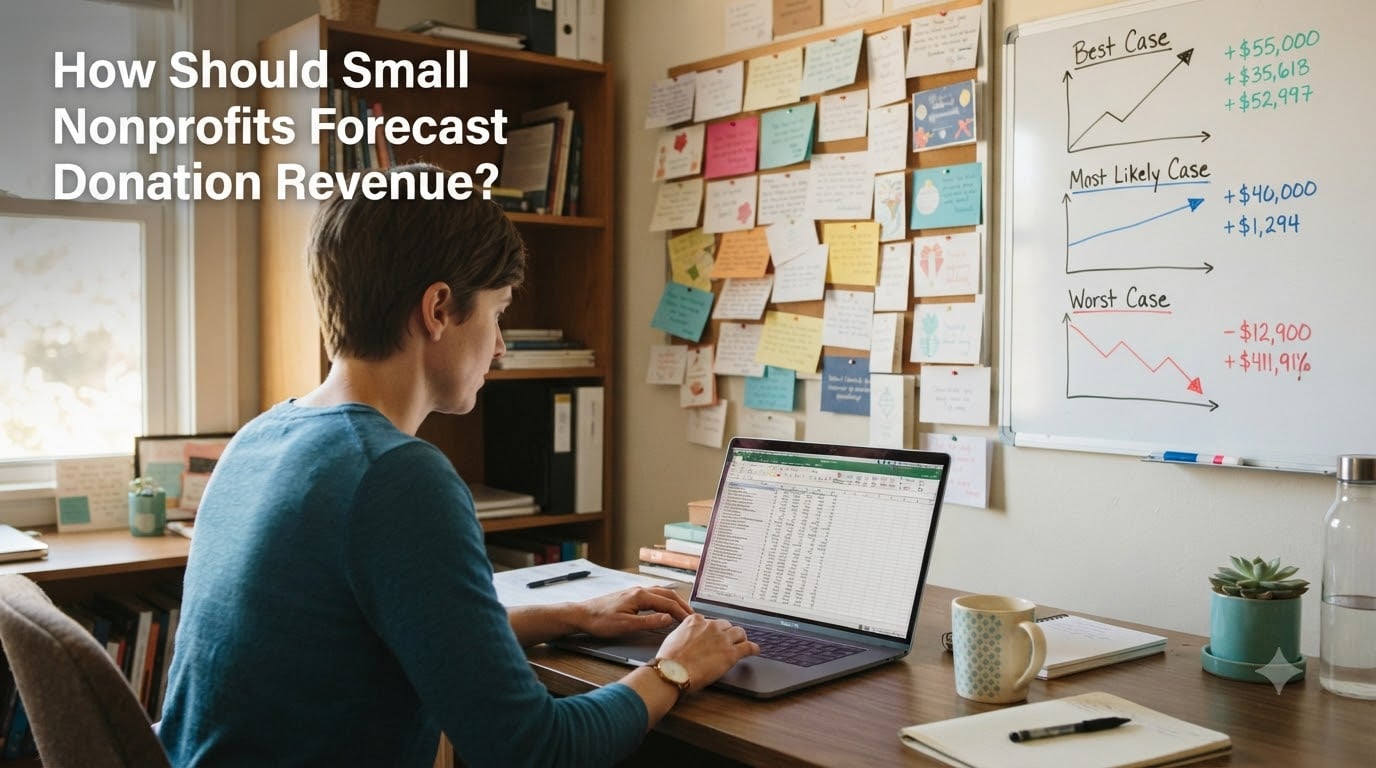
- 7Build Best-Case, Worst-Case, and Most-Likely Scenarios
- 8Set Up a Simple Forecasting Spreadsheet
- 9Warning Signs of Unrealistic Forecasts
- 10Year-Over-Year Comparison and Seasonal Adjustments
- 11Frequently Asked Questions
- 12What is the 33% rule for nonprofits?
- 13What is the best way to forecast revenue?
- 14What is the rule of 3 in nonprofit organizations?
- 15What is the 80/20 rule for nonprofits?
- 16Final Thoughts on Forecasting for Small Nonprofits
Why Donation Revenue Forecasting Matters for Small Nonprofits
If you run a small nonprofit, a bad forecast can quietly end your programs. When revenue falls short, the conversation at the next board meeting turns to layoffs, frozen hiring, or pausing the very services your community depends on. Accurate forecasting is what stops that conversation before it starts.
Here is what we have seen when small nonprofits build a real forecast:
You avoid cash crunches. Most program cuts at small nonprofits trace back to a January-to-March gap that nobody saw coming. A forecast built on historical seasonality tells you in October that you need a bridge.
You build board trust. Boards lose confidence when every quarterly report surprises them. Sharing a realistic forecast, even a modest one, signals that you are running the organization with discipline.
You make better grant decisions. When you know whether you can cover payroll in June, you can decide whether to chase that restricted grant that pays out in September.
You retain staff. Development directors and executive directors burn out when surprises keep landing. A working forecast gives your team a shared map and a clear sense of what is feasible.
You tell a better story to funders. Funders ask about financial sustainability. A documented forecast shows you are not just hoping the money shows up.
How Should Small Nonprofits Forecast Donation Revenue?
The short answer: small nonprofits should forecast donation revenue by combining a 3-to-5-year historical trend analysis with probability-weighted grant projections and three scenarios (best case, worst case, most likely). Start with what you actually raised in past years, adjust for known changes, apply probability to anything not yet secured, and present a range rather than a single number.
Most executive directors we work with want a tidy spreadsheet with one bottom-line number. Resist that. A single number hides risk. Three scenarios, anchored in real history, are far more useful for budget decisions and board conversations.
The whole idea is to replace gut feel with a defensible methodology. Even a simple forecast built on real numbers beats the alternative, which is usually last year’s budget marked up by an arbitrary percentage.
Here is the five-step framework we will expand on in this guide:
Step 1. Gather 3-5 years of giving history from your CRM, accounting software, and bank records.
Step 2. Analyze trends, seasonality, and donor segments to set your baseline.
Step 3. Categorize revenue by source (individual, grants, events, corporate).
Step 4. Apply probability methods to pending grants and verbal pledges.
Step 5. Build best, worst, and most-likely scenarios, then turn those into a monthly cash plan.
Gather Your Historical Giving Data (3-5 Years Minimum)
The foundation of every forecast is real numbers from your own organization. Without them, you are guessing. With them, even messy data can tell a useful story.
Start by pulling giving totals from each of the last 3-5 fiscal years. If your nonprofit is newer than that, use whatever history you have, and supplement with sector benchmarks from Giving USA or GuideStar.
You can find your historical data in four common places:
Donor CRM. Export a report of total gifts received by year, by source code, and by campaign. Most CRMs (Bloomerang, DonorPerfect, Neon CRM, Salesforce NPSP) can do this in under five minutes.
Accounting software. QuickBooks, Aplos, and similar tools hold your actual deposits. Pull a profit-and-loss by month for the last three years, broken down by income source.
Bank statements. If your records are thin, your bank can give you monthly deposit totals by year. Not pretty, but it works. Categorize the largest deposits manually.
Form 990 filings. Your IRS Form 990, available on GuideStar or ProPublica’s Nonprofit Explorer, shows total contributions, program service revenue, and grants received. This is also how you can benchmark your organization against peers of similar size.
Do not worry about perfect categorization at this stage. We just need a clean total per year, ideally broken down by quarter or month. Everything else builds from there.
Pro tip: if your CRM lets you tag gifts by appeal or campaign, run those reports too. They reveal which fundraising channels are growing and which have stalled, which directly informs your forecast assumption for each line.
Analyze Historical Trends and Identify Patterns
Once you have your numbers side by side, the next step is to ask what they are telling you. Most small nonprofits discover three patterns quickly.
Year-over-year growth. Calculate the percentage change between each year. A consistent 4-7% annual growth rate is healthy for a mature small nonprofit. Flat or declining numbers signal donor fatigue, program changes, or external pressure worth investigating before you assume growth in the next forecast.
Seasonal patterns. Almost every small nonprofit has a December spike from year-end giving, and many have a spring or fall event bump. Map your monthly totals onto a calendar and you will see your rhythm. We worked with one organization where 38% of revenue landed in December alone. That is not a problem, but it changes how you plan cash flow for January through March.
The 80/20 rule. Roughly 80% of your fundraising results typically come from 20% of your donors. Pull a top-donor report from your CRM. If your top 10 donors represent more than half your revenue, your forecast is more fragile than you think, and retention of those donors deserves weekly attention.
Donor retention. Compare how many donors gave last year and this year. Most small nonprofits retain 40-60% of donors year over year. Anything below 40% is a red flag. Anything above 60% is a competitive advantage you should protect.
Acquisition vs repeat giving. Track how much of your revenue each year comes from new donors versus repeat donors. If new donor acquisition is falling, your long-term revenue will fall too, with an 18-24 month lag. This is one of the most useful early warning indicators for nonprofit revenue prediction.
Categorize Your Revenue Sources
Different revenue streams behave differently, so you forecast each one with its own method. For a typical small nonprofit, the breakdown looks something like this:
Individual giving. Usually 50-80% of contributed revenue for small organizations. Includes one-time gifts, recurring monthly donors, and major gifts. Forecast using historical growth adjusted for known donor changes, planned appeals, and any new acquisition campaigns you have funded.
Grants. Foundation, corporate, and government grants. Usually 10-40% of revenue. These require probability forecasting because most are not confirmed until awarded.
Special events. Galas, runs, community fundraisers. Often 5-20% of revenue but high cost. Forecast gross, then subtract event expenses to find net contribution. Many small nonprofits accidentally overestimate event revenue because they forget the production costs.
Corporate sponsorships and earned income. Smaller line items but worth tracking separately because they often behave like grants in terms of risk, wither by relationship or by contract.
The split matters because individual giving grows roughly with inflation and donor retention, while grants are project-driven and can swing 30% or more year to year. If your nonprofit relies on one grant for more than 25% of revenue, your small nonprofit donation revenue forecast needs explicit scenario planning around what happens if that grant does not renew.
Apply Probability Methods to Grants and Pledges
This is where most small nonprofit forecasts go wrong. People add up every grant they have applied for and treat that as expected revenue. It is not expected. It is possible. The two probability methods below turn possibilities into realistic numbers.
Discount method. You assign a probability percentage to each pending grant based on your read of the funder, the relationship, and the fit. Multiply the requested amount by that probability and sum the results.
For example, if you applied for $25,000 from a foundation that funded you last year, you might assign 75% probability, giving you $18,750 in expected revenue. A cold application to a new funder might get 20%, contributing $4,000 from a $20,000 request.
Cutoff method. Simpler and faster. You draw a line: only count grants above a certain probability threshold (say 60% or higher) as expected revenue. Anything below that line gets excluded from the main forecast but tracked separately as upside.
Both methods work. The discount method gives you a more nuanced number and is preferred when you have many pending grants. The cutoff method is faster and easier to defend to a board that does not want to debate percentages.
For major gifts and pledged donations, apply the same logic. A donor who has given verbally but not signed a pledge letter should not be counted at 100%. We typically discount verbal pledges to 50-70% until they are written and dated. This single practice prevents many of the awkward surprise shortfalls small nonprofits experience mid-year.
If you use the nonprofit forecast method known as probability ranking, label each prospect A, B, C, or D based on readiness. A prospects (90%) are nearly confirmed and count almost in full. B prospects (50%) are warm and probable. C prospects (25%) are still cultivating. D prospects (10%) are early-stage and serve as upside only.
Build Best-Case, Worst-Case, and Most-Likely Scenarios
This is the rule of three for nonprofits: never present a single revenue number. Always present a range.
Most-likely scenario. Your baseline forecast. Historical trends, retention rates you have actually achieved, grants at probability-weighted amounts, and modest growth in recurring giving. This is the number you plan against, the number you use to set staff salaries and program budgets.
Best-case scenario. Everything breaks right. All your top-probability grants come in, a major gift lands unexpectedly, your year-end appeal outperforms by 15%. Add 15-25% to your most-likely number. Treat the upside carefully: budget allocations should not depend on best-case revenue.
Worst-case scenario. Two major donors lapse, the largest pending grant gets declined, and your event underperforms. Subtract 15-25% from your most-likely number.
Now you have a range, not a guess. The board can see that even in the bad case, you can cover payroll and rent for the year, with specific cuts identified. In the good case, you can fund that pilot program you have been dreaming about.
This range is also your stress test. If your worst-case scenario would force immediate layoffs, you know you need to either build reserves or scale back commitments before signing that new lease or committing to a multi-year hire.
Set Up a Simple Forecasting Spreadsheet
You do not need forecasting software. A well-built Google Sheet or Excel file works perfectly for small nonprofits. Here is the layout I recommend.
Column A: Revenue source (Individual Giving, Grants, Events, Corporate, Other).
Column B: Prior year actual (last fiscal year total).
Column C: Two-year prior actual.
Column D: Three-year prior actual (if available).
Column E: Growth assumption (your expected percentage change, conservative).
Column F: Most-likely forecast (Prior year times Growth assumption).
Columns G through R: Monthly breakdown of the most-likely forecast, weighted by your historical seasonality.
Column S: Best-case total.
Column T: Worst-case total.
Then add a second tab that pulls in actual monthly revenue and shows variance against forecast. Update it on the first business day of each month. The act of comparing actual to forecast is where the real learning happens, and it is where small nonprofits catch problems while they are still small.
If your team is stretched thin, this monthly review can be a 30-minute meeting with the executive director and bookkeeper. No fancy dashboards required, just the spreadsheet, a coffee, and an honest conversation about what is working and what is not.
Warning Signs of Unrealistic Forecasts
After reviewing hundreds of nonprofit budgets, I can usually spot a bad forecast within a minute. Here are the warning signs to watch for in your own work and to flag if you see them in board packets.
Growth rates above 25% year over year, every year. If you are projecting 30% growth in year five of a mature program, you are probably inflating the forecast. Realistic nonprofit fundraising projections grow with retention and acquisition, not miracle jumps.
Pending grants counted at full value. Until the check is in the bank, a grant is a possibility, not revenue. Counting it at 100% is the single most common forecasting error I see in small nonprofit budgets.
No scenario range. If your budget shows one number with no range, your finance committee is being asked to approve a guess. Insist on best, worst, and most-likely even if your board has never asked for it.
Ignoring donor churn. If your retention rate is 45%, you cannot assume all last year’s donors will give again at the same level. Budget for lapses.
Event revenue counted gross. A gala that brings in $80,000 but costs $60,000 contributes $20,000. Forecast the net, not the gross.
Zero buffer. If your forecast exactly equals your expenses with nothing left over, you have no margin for the surprises that always come. Build at least a 5% contingency into your expense budget if reserves allow.
No monthly breakdown. Annual totals hide cash flow problems. A forecast broken out by month lets you see whether you will have money in the bank when payroll hits on the 15th.
Year-Over-Year Comparison and Seasonal Adjustments
Your forecast should not just look at total revenue. It should compare year over year, month by month, to surface meaningful shifts. If your January giving used to be 8% of annual and is now 5%, something has changed, maybe a major recurring donor lapsed, and your forecast needs to adapt.
For year-over-year comparison, build a simple table with one row per month and one column per year for the last three years. Total each column to confirm it matches your annual totals, then calculate percentage change month by month. The biggest jumps or drops in that table are where the real story lives.
Seasonal adjustments matter because spending does not match giving. You collect 40% of revenue in November and December, then pay predictable expenses every month. A forecast that ignores seasonality will show you profitable and not-profitable months, but a forecast that respects it shows you exactly when you need to draw on reserves.
One small nonprofit we worked with used their forecast to negotiate a line of credit in October, covering the slow February-to-April gap they could now see clearly in the data. That line of credit saved them from a panicked appeal mid-crisis the following year.
Frequently Asked Questions
What is the 33% rule for nonprofits?
The 33% rule suggests that roughly one-third of an organization’s fundraising revenue should come each from individual donors, institutional funders, and earned income or events. While not a hard law, it offers small nonprofits a simple guideline for diversifying revenue so a single lost source does not jeopardize the entire budget.
What is the best way to forecast revenue?
The best way to forecast revenue combines three elements: historical trend analysis of 3-5 years of giving data, probability weighting for any unconfirmed grants or pledges, and scenario planning that produces a range (best case, worst case, most likely). For small nonprofits, this three-part approach beats single-number guessing every time.
What is the rule of 3 in nonprofit organizations?
The rule of 3 in nonprofit organizations refers to presenting forecasts as three scenarios rather than a single number. You build a best-case scenario (everything goes right), a worst-case scenario (two major donors lapse and a grant is denied), and a most-likely scenario grounded in real history. This range helps boards make decisions under real uncertainty.
What is the 80/20 rule for nonprofits?
The 80/20 rule for nonprofits states that roughly 80% of fundraising results typically come from 20% of donors. For small nonprofits, this means a handful of major donors and recurring givers drive most of the budget. The practical takeaway: focus retention effort on your top quintile of donors and your forecast becomes more reliable.
Final Thoughts on Forecasting for Small Nonprofits
A donation revenue forecast is not a one-time deliverable you hand to the board in November. It is a working document you update every month, learning from each variance between forecast and actual. Start with what you raised last year, adjust for what you know, apply probability to what you hope, and present a range. That is how small nonprofits forecast donation revenue without burning out the team or overselling the numbers.
Pull three years of giving history this week, run the discount method on your pending grants, and build your three scenarios by the end of the month. Your future self, your staff, and your board will thank you. And if you only take one thing from this guide, take this: a humble forecast with a range beats a confident number you cannot defend.