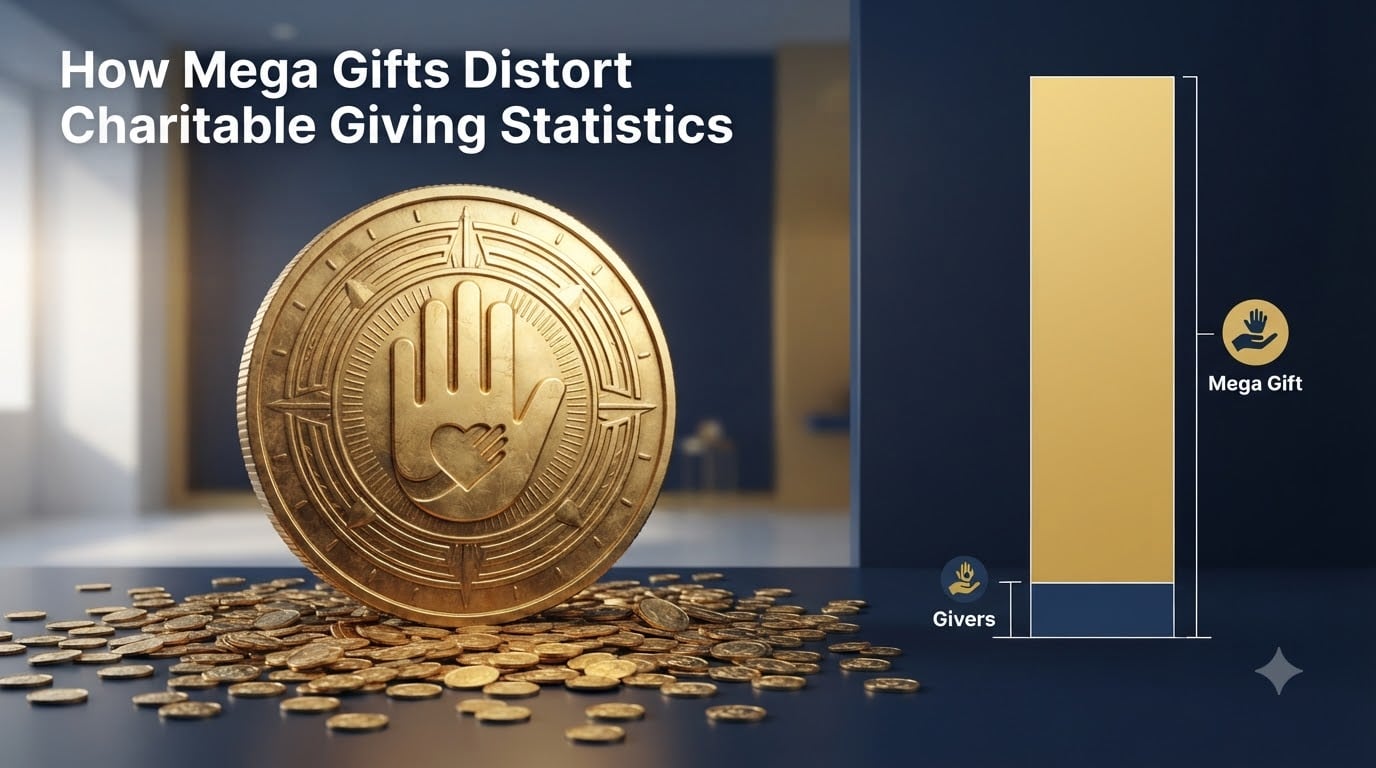
Americans gave an estimated $617.2 billion to charity last year. That headline number sounds like a triumph for generosity. But it hides a story that every nonprofit leader, researcher, and policymaker needs to understand. Mega gifts charitable giving statistics are deeply distorted by a small number of ultra-large donations that make the sector look healthier than it actually is.
Behind those record-breaking totals, fewer households are giving than at any point in modern history. The share of American households donating to charity dropped from roughly 66% in 2000 to under 50% today. Meanwhile, the threshold for what researchers call a “mega gift” has skyrocketed from $30 million in 2011 to $450 million in 2021. A handful of billionaires now move enough money to swing national totals by percentage points in a single year.
I have spent years analyzing philanthropy data, and the gap between headline numbers and grassroots reality keeps widening. When one donor writes a $10 billion check, it can mask the fact that millions of small donors stopped giving altogether. That is not a minor statistical footnote. It changes how we understand the health of American generosity, how nonprofits plan their fundraising, and how lawmakers think about tax policy.
This article breaks down exactly how mega gifts distort charitable giving statistics. We will look at the methodology behind the numbers, the decline of everyday donors, the growing concentration of wealth in philanthropy, and practical ways to read giving data without being misled.
Table of Contents
- 1What Are Mega Gifts and How Do They Distort Charitable Giving Statistics
- 2The Giving USA Methodology and Why It Amplifies Mega Gifts
- 3The Decline of Small and Middle-Income Donors
- 4How Mega Donors Concentrate Charitable Giving
- 5The Role of Donor-Advised Funds and Private Foundations
- 6Real-World Examples of Mega Gift Distortion
- 7How to Interpret Charitable Giving Statistics Critically
- 8Demographic Patterns in Charitable Giving
- 9FAQs
- 10What is the 33% rule for nonprofits?
- 11Do Democrats or Republicans donate more to charity?
- 12What is the 30/70 rule for charities?
- 13Why do charities ask for $19 a month instead of $20?
- 14What This Means for the Future of Philanthropy
What Are Mega Gifts and How Do They Distort Charitable Giving Statistics
Mega gifts are exceptionally large charitable donations that inflate overall giving totals while masking declines in everyday donor participation. Giving USA, the annual report that tracks U.S. philanthropy, adjusts its mega-gift threshold year by year based on the largest gifts recorded. In 2011, a gift of $30 million or more qualified. By 2021, that threshold had jumped to $450 million.
Here is where the distortion begins. Giving USA counts total charitable contributions in the year they are made, regardless of size. When MacKenzie Scott distributed roughly $8.5 billion across hundreds of nonprofits in a single year, all of it landed in that year’s total. The headline number surged. But the number of households giving to charity did not budge.
This creates a paradox that our team sees repeatedly in the data. Total giving goes up while donor participation goes down. The sector looks like it is growing when, for most nonprofits, it is actually shrinking. Small and mid-sized organizations that depend on $50 to $500 gifts feel the squeeze even as national totals break records.
The problem matters because people use these headline numbers to make decisions. A foundation board might look at rising totals and conclude the sector does not need more support. A lawmaker might resist charitable deduction reform because “giving is at record highs.” A journalist might write a story about American generosity booming when the opposite is true for the majority of households.
Think of it this way. If one person in a room of 100 people wins a $1 billion lottery, the average net worth of everyone in that room jumps by $10 million. But that number tells you nothing about what the other 99 people are experiencing. That is exactly what mega gifts do to charitable giving statistics.
The Giving USA Methodology and Why It Amplifies Mega Gifts
Giving USA is the gold standard for tracking American philanthropy. Published annually by the Giving USA Foundation and researched by the Indiana University Lilly Family School of Philanthropy, it aggregates data from IRS filings, foundation grants, corporate giving records, and donor-advised fund distributions. The report is rigorous and widely trusted.
But its methodology has a built-in vulnerability when it comes to mega gifts. The report counts contributions in the year they are made or pledged. It does not separate mega gifts from everyday household giving in its headline totals. This means a single $5 billion bequest can add nearly a full percentage point to the annual giving figure in one year, then disappear the next.
Inflation adjustment adds another layer. When Giving USA reports giving in current dollars, mega gifts push the nominal total higher. When it reports in inflation-adjusted dollars, the picture can look different depending on when the mega gift was counted. A large gift in a high-inflation year has a different real-dollar impact than the same gift in a low-inflation year.
Our team has compared Giving USA totals with IRS itemized deduction data side by side. The pattern is consistent. Years with well-publicized mega gifts show sharp spikes in the headline number. Strip out gifts above the mega threshold, and the underlying trend tells a very different story, one of stagnation or decline for most categories of giving.
The Decline of Small and Middle-Income Donors
The most troubling trend hidden behind headline numbers is the steady exit of small and middle-income donors from charitable giving. In 2000, approximately 66% of American households made a charitable donation. By 2026, that figure had fallen below 50%, according to research from the Indiana University Lilly Family School of Philanthropy.
This is not a gradual dip. It is a structural shift. Middle-income households have been hit by stagnant wages, rising housing costs, and medical debt. When budgets tighten, charitable giving is often the first discretionary expense to go. The result is a donor base that is shrinking from the bottom up.
The 2017 tax law made the problem worse. By nearly doubling the standard deduction in 2018, it removed the financial incentive for millions of households to itemize their taxes. Before the change, about 30% of taxpayers itemized deductions, and charitable giving was a key motivation. After the change, that figure dropped to roughly 10%. Without the tax benefit, many households simply gave less or stopped giving.
Nonprofit workers on Reddit’s philanthropy forums describe this from the front lines. One fundraiser noted that their organization lost 40% of its small-gift donors over five years, even as it received a single seven-figure gift that kept the annual total flat. The organization looked stable on paper. In reality, its community support was hollowing out.
There is also a psychological dimension. When headlines celebrate billion-dollar gifts from tech billionaires, small donors can feel their $25 contribution does not matter. Researchers call this the “confidence gap.” If everyday donors believe their giving is insignificant compared to mega gifts, they disengage. The statistics create a self-reinforcing cycle of decline.
How Mega Donors Concentrate Charitable Giving
The concentration of charitable giving among the wealthy has accelerated dramatically. Roughly 67% of all itemized charitable deductions now come from households earning $200,000 or more. A commonly cited benchmark in the fundraising world is that 5% of donors account for 95% of philanthropic dollars. Whether the exact split is 80/20 or 95/5, the direction is clear: giving is becoming top-heavy.
Nonprofit Quarterly compared the top 50 donors against all other American donors and found a stark divergence. The top 50 collectively gave tens of billions annually, while the combined giving of the remaining donor base was shrinking in real terms. The top of the pyramid is growing. The base is shrinking. The middle is disappearing.
MacKenzie Scott’s giving model illustrates this perfectly. Between 2020 and 2022, she distributed more than $14 billion in unrestricted grants to hundreds of organizations. Her approach was praised for its speed, transparency, and trust in recipients. But from a statistical standpoint, her gifts alone were large enough to move national giving totals in each of those years.
This concentration has real consequences for nonprofit independence. When a single donor provides a large share of an organization’s budget, that donor’s priorities shape the organization’s direction. The forum insight that nonprofit leaders “chase mega donors at the expense of building a broader donor base” reflects a genuine tension. Short-term financial stability comes at the cost of long-term community accountability.
The Role of Donor-Advised Funds and Private Foundations
Donor-advised funds and private foundations add another layer of complexity to charitable giving statistics. Both are intermediary vehicles that sit between the donor and the operating charity. When a billionaire puts $1 billion into a DAF or foundation, that transfer is often counted as a charitable contribution, even if the money has not yet reached a working nonprofit.
Donor-advised funds have grown explosively over the past decade. Assets in DAFs surpassed $200 billion in recent years, and the number of DAF accounts has more than tripled. DAFs offer immediate tax deductions without any legal requirement to distribute funds to operating charities on a specific timeline. The money can sit in the account for years, accruing value, while the original contribution has already been counted in giving statistics.
Private foundations operate under a 5% minimum distribution requirement, meaning they must distribute at least 5% of their net investment assets annually. But even this rule has flexibility in how distributions are counted. Administrative expenses, grants to other foundations, and program-related investments can all count toward the payout. The effective amount reaching frontline nonprofits can be lower than the 5% figure suggests.
This is why forum users express frustration that philanthropy often looks like “money sloshing around among wealthy intermediaries.” A billion-dollar gift might move from a donor to a foundation to a DAF to another intermediary before a single dollar reaches a food bank or community clinic. Each transfer may generate a press release and a statistical entry. But the impact on the ground is delayed, diluted, and difficult to track.
Reform advocates have proposed requiring DAFs to distribute funds within a set number of years. Others want to increase foundation payout requirements or close loopholes in how distributions are counted. These proposals aim to ensure that money counted as “given to charity” actually reaches charities doing work in the community.
Real-World Examples of Mega Gift Distortion
Concrete examples make the distortion easier to see. In 2011, Giving USA set its mega-gift threshold at $30 million, and gifts above that level totaled about $2.7 billion. A decade later, in 2021, the threshold had jumped to $450 million. Gifts above that much higher threshold alone totaled far more than the entire 2011 mega-gift pool.
That means the definition of “mega” had to be raised fifteenfold just to track the largest gifts. The number of gifts between $30 million and $450 million had become so common that they no longer qualified as outliers. This is not a sign of broadly shared generosity. It is a sign of wealth concentration feeding directly into the giving pipeline.
The year 2020 provides a vivid illustration. Americans gave a record-breaking $471 billion, and headlines celebrated a surge in generosity during a crisis. But MacKenzie Scott’s billions, plus large gifts from other billionaires, accounted for a significant share of that increase. Remove the top ten gifts, and the remaining growth was modest, even anemic when adjusted for inflation and population growth.
Another telling comparison comes from corporate giving. Companies donate roughly 1% to 2% of their profits to charity, a figure that has stayed essentially flat for years. Reddit users on data-focused forums frequently point out that corporate profits have soared while corporate giving has not kept pace. Yet corporate giving totals are reported alongside individual giving, making the combined number look stronger than either component alone would justify.
How to Interpret Charitable Giving Statistics Critically
Understanding mega gifts charitable giving statistics requires reading the numbers with a critical eye. Here is a practical framework I use when evaluating philanthropy data.
Step 1: Separate total giving from donor participation. A rising total with falling participation means the average donor is not reflected in the headline number. Always look for both metrics.
Step 2: Check whether figures are inflation-adjusted. Nominal dollar totals can increase while real purchasing power stays flat or declines. Giving USA reports both, but headlines usually cite only the nominal figure.
Step 3: Identify mega gifts in the data. Look for the mega-gift threshold for that year and estimate what percentage of the total came from gifts above it. Giving USA sometimes provides this breakdown, and Nonprofit Quarterly has published useful analyses.
Step 4: Look at giving as a percentage of GDP. This metric has hovered around 2% for decades, which means giving has not grown relative to the overall economy. When GDP rises, giving rises in absolute terms even if generosity is flat.
Step 5: Track intermediary growth separately from direct giving. If DAF and foundation assets are growing faster than distributions to operating charities, a growing share of “charitable giving” is sitting in accounts rather than funding programs.
Step 6: Pay attention to donor retention rates. The Fundraising Effectiveness Report tracks how many first-time donors give again. Only about 19% of new donors make a second gift. That number tells you more about the health of the sector than any annual total.
Demographic Patterns in Charitable Giving
Who gives to charity is just as important as how much is given. Research from the Philanthropy Roundtable and the Lilly School of Philanthropy reveals clear patterns along income, education, religion, and political affiliation lines.
Higher-income households give more in absolute dollars, but lower-income households give a larger percentage of their income. Households earning under $25,000 annually give an average of 4% to 5% of their income, while households earning over $200,000 give closer to 2% to 3%. The wealthy dominate the dollar totals, but the working poor are often the most generous relative to their means.
Religious affiliation correlates strongly with charitable giving. Households that attend religious services regularly give at higher rates and in larger amounts than non-attending households, even when excluding religious donations. Education also plays a role, with college-educated households giving at higher rates than those without degrees.
Political affiliation shows a more nuanced picture. Conservative-leaning states tend to rank higher in percentage-of-income giving, partly because they have higher rates of religious attendance. When researchers control for income and religion, the partisan gap narrows significantly. The data suggests that cultural and religious factors, more than political ideology itself, drive giving behavior.
Understanding these patterns matters because mega gift statistics skew the demographic picture. When billion-dollar gifts from a handful of billionaires dominate the totals, the giving profile of ordinary Americans disappears from view. The result is a distorted national portrait of who we are as givers.
FAQs
What is the 33% rule for nonprofits?
The 33% rule is a general benchmark suggesting that a nonprofit’s total expenses should not exceed 33% of its annual revenue, ensuring the organization maintains sufficient reserves and operates sustainably. Some interpret it as guidance that fundraising costs should stay below 33% of total expenses. In practice, healthy ratios vary widely by organization type and size, and the 33% figure is a rough guideline rather than a regulatory standard.
Do Democrats or Republicans donate more to charity?
Research shows that conservative-leaning states and Republican-leaning households tend to give a higher percentage of their income to charity, largely driven by higher rates of religious attendance in those demographics. However, when researchers control for income, religiosity, and geography, the partisan gap narrows significantly. Both groups give substantially, and cultural factors like religion and community ties matter more than political affiliation alone.
What is the 30/70 rule for charities?
The 30/70 rule in philanthropy generally refers to the expectation that roughly 30% of charitable giving comes from major donors while 70% comes from a broader base of everyday donors. In practice, this ratio has flipped dramatically, with some estimates suggesting that as little as 5% of donors now account for up to 95% of philanthropic dollars, making the traditional 30/70 model obsolete for many organizations.
Why do charities ask for $19 a month instead of $20?
Charities ask for $19 a month instead of $20 because the lower number feels significantly more affordable to donors due to psychological pricing, also called charm pricing. The number 19 reads as ‘less than twenty’ rather than ‘almost twenty,’ reducing the perceived commitment. This strategy has been shown to increase conversion rates for monthly giving programs, which are the lifeblood of many nonprofits.
What This Means for the Future of Philanthropy
Mega gifts charitable giving statistics paint a picture of a sector that looks healthy on the surface but is increasingly fragile underneath. Record-breaking headlines obscure the fact that fewer Americans are giving, small donors are disengaging, and a growing share of philanthropic money sits in intermediary accounts rather than reaching the communities that need it.
The path forward requires reading statistics critically, supporting broad-based donor participation, and ensuring that money counted as charitable giving actually reaches working charities. The numbers only tell us the truth if we know how to read them.